This tool is useful to calculate the time value of money based on historical inflation and CPI values. To start, select an amount and two years, or browse the default calculation results.
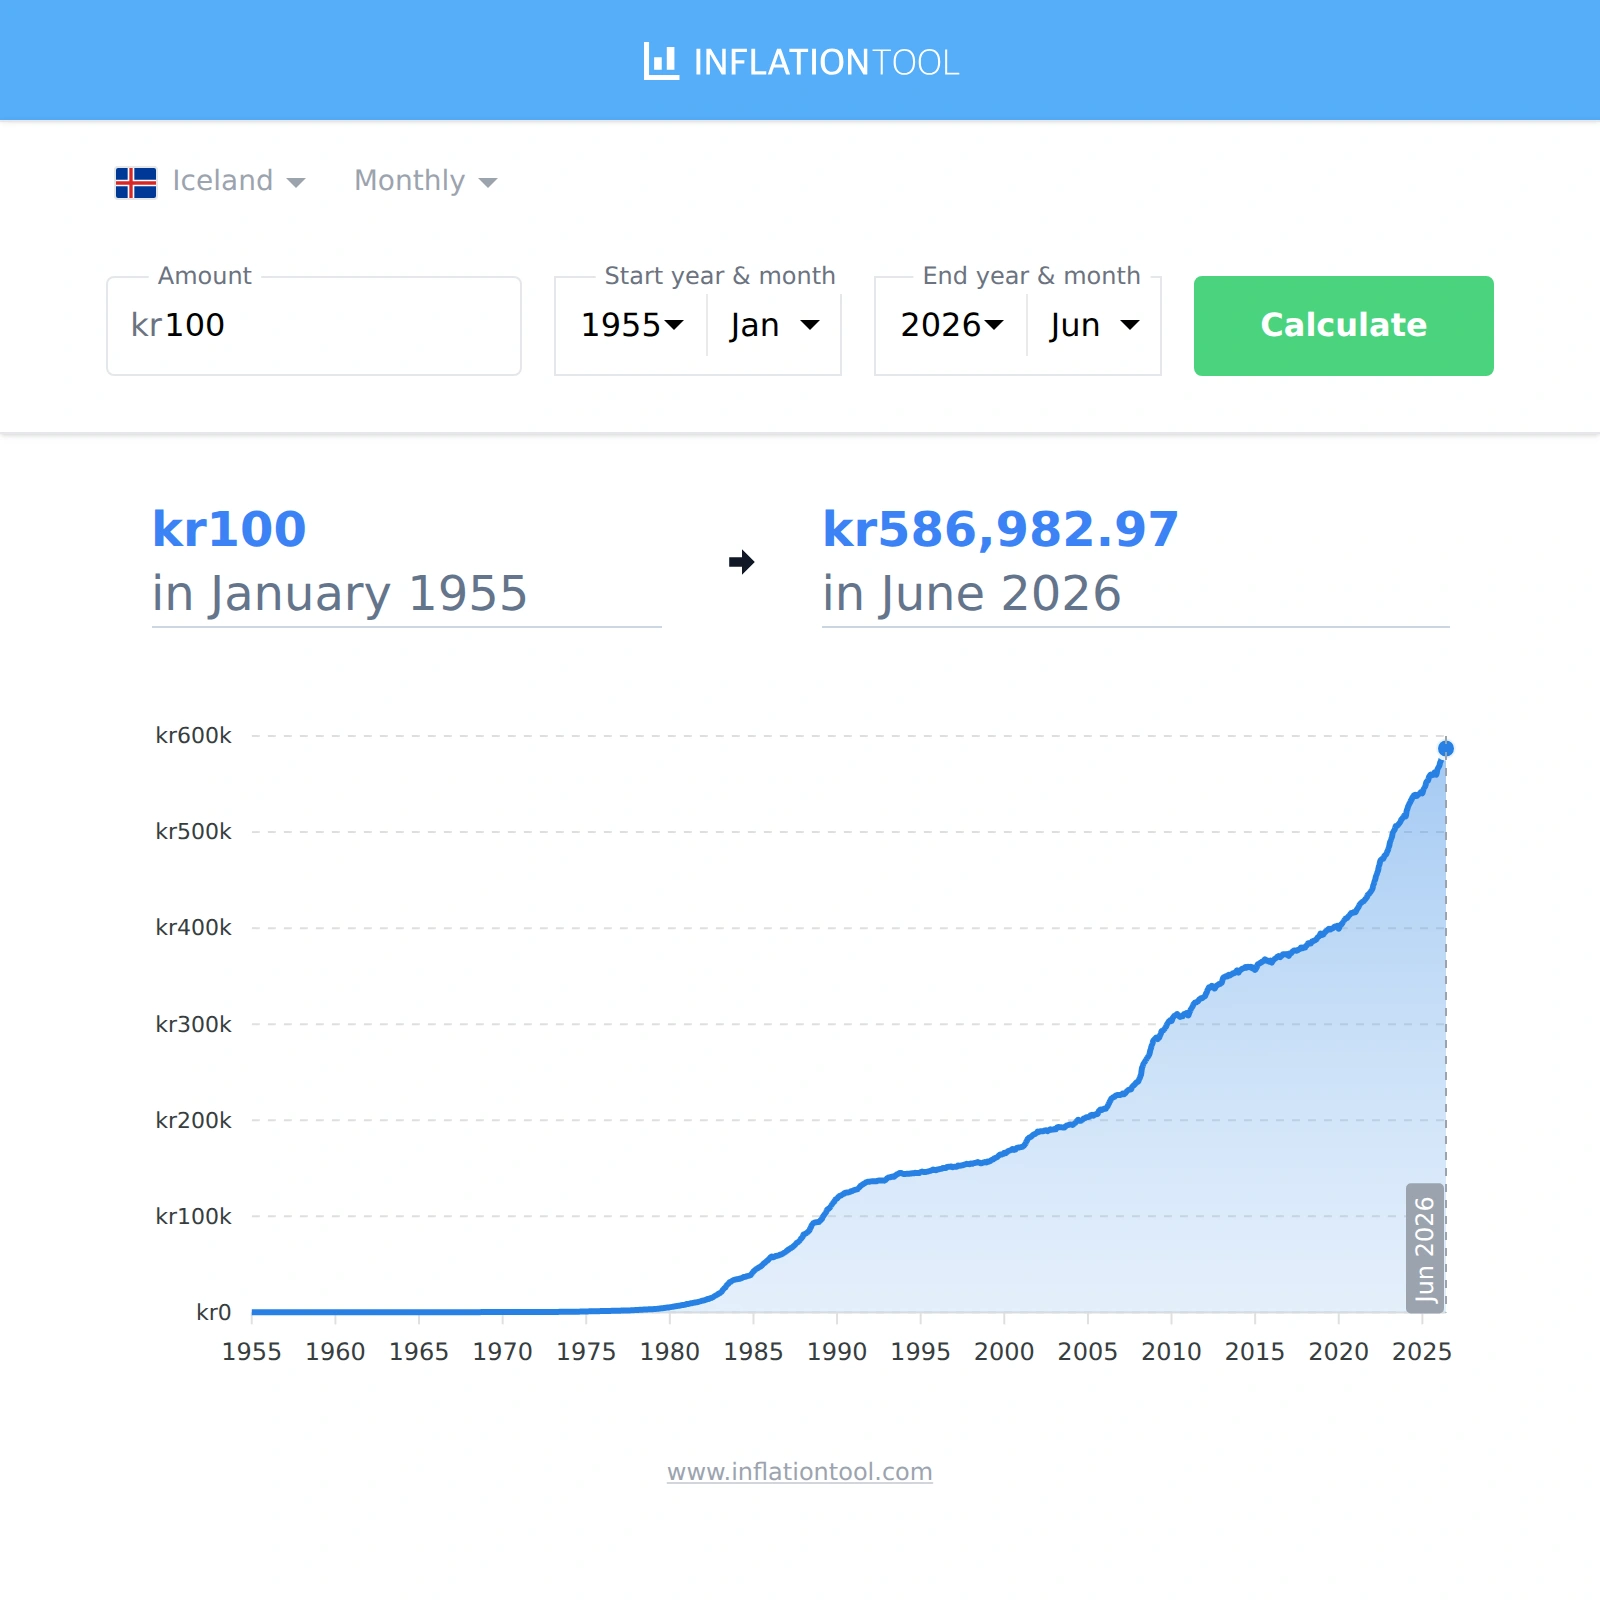
The cumulative inflation rate in Iceland between January 1955 and June 2026 was 586,882.97%, meaning that overall prices were 5,869.8 times higher than they were in January 1955. In other words, the purchasing power of kr100 in Jan 1955 was equivalent to kr586,982.97 in Jun 2026. The average annual inflation rate over this period was 1.02%.
The chart below shows how the value of kr100 changes over time when adjusted for inflation, based on Consumer Price Index (CPI) data. All values are equivalent in terms of purchasing power, indicating how much money would be needed each year to buy the same goods or services.
All calculations are performed in Icelandic kronur with six-decimal precision, though displayed values are rounded to two decimals for readability. Inflation figures are sourced from official government and international reports released monthly.
The following table contains relevant indicators:
| Indicator | Value |
|---|---|
| Cumulative inflation from 1955-01 to 2026-06 | 586,882.97% |
| Avg. Monthly inflation from 1955-01 to 2026-06 | 1.02% |
| CPI 1955-01 | 0.027 |
| CPI 2026-06 | 161.31 |
There are several ways to calculate the time value of money. Depending on the data available, results can be obtained by using the Consumer Price Index (CPI) formula or the compound interest formula.
When we have both the start and end months, we can use the following formula:
To obtain the values equivalent in buying power between January 1955 and June 2026, use the corresponding CPI values:
Given that money changes with time as a result of an inflation rate that acts as compound interest, we can use the following formula: FV = PV × (1 + i)n, where:
In this case, the future value represents the final amount obtained after applying the inflation rate to our initial value. In other words, it indicates how much are kr100 worth today. There are 857 months between January 1955 and June 2026 and the average inflation rate was 1.0177%. Therefore, we can resolve the formula like this:
| Initial Value | Equivalent value | |
|---|---|---|
| kr1 krona in 1955-01 | → | kr5,869.83 kronur in 2026-06 |
| kr5 kronur in 1955-01 | → | kr29,349.15 kronur in 2026-06 |
| kr10 kronur in 1955-01 | → | kr58,698.3 kronur in 2026-06 |
| kr50 kronur in 1955-01 | → | kr293,491.49 kronur in 2026-06 |
| kr100 kronur in 1955-01 | → | kr586,982.97 kronur in 2026-06 |
| kr500 kronur in 1955-01 | → | kr2.93M kronur in 2026-06 |
| kr1,000 kronur in 1955-01 | → | kr5.87M kronur in 2026-06 |
| kr5,000 kronur in 1955-01 | → | kr29.35M kronur in 2026-06 |
| kr10,000 kronur in 1955-01 | → | kr58.7M kronur in 2026-06 |
| kr50,000 kronur in 1955-01 | → | kr293.49M kronur in 2026-06 |
| kr100,000 kronur in 1955-01 | → | kr586.98M kronur in 2026-06 |
| kr500,000 kronur in 1955-01 | → | kr2.93B kronur in 2026-06 |
| kr1,000,000 kronur in 1955-01 | → | kr5.87B kronur in 2026-06 |
| Cumulative inflation Jan 1955-Jun 2026 | 586,882.97% |
| Avg. monthly inflation Jan 1955-Jun 2026 | 1.02% |
| Avg. annual inflation 1955-2025 | 13.07% |
| CPI 1955-01 | 0.027 |
| CPI 2026-06 | 161.31 |
| Period | Value |
|---|---|
| 1955-01 | kr100 |
| 1955-02 | kr100 |
| 1955-03 | kr100 |
| 1955-04 | kr100 |
| 1955-05 | kr100 |
| 1955-06 | kr101.25 |
| 1955-07 | kr102.5 |
| 1955-08 | kr102.5 |
| 1955-09 | kr102.5 |
| 1955-10 | kr106.25 |
| 1955-11 | kr107.5 |
| 1955-12 | kr107.5 |
| 1956-01 | kr108.75 |
| 1956-02 | kr108.75 |
| 1956-03 | kr110 |
| 1956-04 | kr111.25 |
| 1956-05 | kr112.5 |
| 1956-06 | kr112.5 |
| 1956-07 | kr115 |
| 1956-08 | kr115 |
| 1956-09 | kr115 |
| 1956-10 | kr115 |
| 1956-11 | kr115 |
| 1956-12 | kr115 |
| 1957-01 | kr115 |
| 1957-02 | kr115 |
| 1957-03 | kr116.25 |
| 1957-04 | kr117.5 |
| 1957-05 | kr117.5 |
| 1957-06 | kr117.5 |
| 1957-07 | kr118.75 |
| 1957-08 | kr118.75 |
| 1957-09 | kr118.75 |
| 1957-10 | kr118.75 |
| 1957-11 | kr118.75 |
| 1957-12 | kr118.75 |
| 1958-01 | kr118.75 |
| 1958-02 | kr118.75 |
| 1958-03 | kr118.75 |
| 1958-04 | kr118.75 |
| 1958-05 | kr118.75 |
| 1958-06 | kr120 |
| 1958-07 | kr123.75 |
| 1958-08 | kr125 |
| 1958-09 | kr126.25 |
| 1958-10 | kr133.75 |
| 1958-11 | kr135 |
| 1958-12 | kr136.25 |
| 1959-01 | kr131.25 |
| 1959-02 | kr127.5 |
| 1959-03 | kr125 |
| 1959-04 | kr125 |
| 1959-05 | kr125 |
| 1959-06 | kr125 |
| 1959-07 | kr125 |
| 1959-08 | kr125 |
| 1959-09 | kr125 |
| 1959-10 | kr125 |
| 1959-11 | kr125 |
| 1959-12 | kr125 |
| 1960-01 | kr125 |
| 1960-02 | kr125 |
| 1960-03 | kr126.25 |
| 1960-04 | kr130 |
| 1960-05 | kr131.25 |
| 1960-06 | kr131.25 |
| 1960-07 | kr128.75 |
| 1960-08 | kr130 |
| 1960-09 | kr126.25 |
| 1960-10 | kr127.5 |
| 1960-11 | kr128.75 |
| 1960-12 | kr128.75 |
| 1961-01 | kr130 |
| 1961-02 | kr130 |
| 1961-03 | kr130 |
| 1961-04 | kr130 |
| 1961-05 | kr130 |
| 1961-06 | kr130 |
| 1961-07 | kr131.25 |
| 1961-08 | kr132.5 |
| 1961-09 | kr137.5 |
| 1961-10 | kr142.5 |
| 1961-11 | kr143.75 |
| 1961-12 | kr143.75 |
| 1962-01 | kr145 |
| 1962-02 | kr145 |
| 1962-03 | kr145 |
| 1962-04 | kr145 |
| 1962-05 | kr145 |
| 1962-06 | kr145 |
| 1962-07 | kr146.25 |
| 1962-08 | kr150 |
| 1962-09 | kr152.5 |
| 1962-10 | kr156.25 |
| 1962-11 | kr156.25 |
| 1962-12 | kr157.5 |
| 1963-01 | kr160 |
| 1963-02 | kr160 |
| 1963-03 | kr161.25 |
| 1963-04 | kr162.5 |
| 1963-05 | kr163.75 |
| 1963-06 | kr163.75 |
| 1963-07 | kr165 |
| 1963-08 | kr166.25 |
| 1963-09 | kr172.5 |
| 1963-10 | kr180 |
| 1963-11 | kr182.5 |
| 1963-12 | kr182.5 |
| 1964-01 | kr186.25 |
| 1964-02 | kr191.25 |
| 1964-03 | kr197.5 |
| 1964-04 | kr201.25 |
| 1964-05 | kr203.75 |
| 1964-06 | kr203.75 |
| 1964-07 | kr203.75 |
| 1964-08 | kr203.75 |
| 1964-09 | kr203.75 |
| 1964-10 | kr203.75 |
| 1964-11 | kr203.75 |
| 1964-12 | kr206.25 |
| 1965-01 | kr208.75 |
| 1965-02 | kr210 |
| 1965-03 | kr210 |
| 1965-04 | kr211.25 |
| 1965-05 | kr213.75 |
| 1965-06 | kr213.75 |
| 1965-07 | kr213.75 |
| 1965-08 | kr215 |
| 1965-09 | kr217.5 |
| 1965-10 | kr221.25 |
| 1965-11 | kr225 |
| 1965-12 | kr225 |
| 1966-01 | kr227.5 |
| 1966-02 | kr228.75 |
| 1966-03 | kr230 |
| 1966-04 | kr231.25 |
| 1966-05 | kr238.75 |
| 1966-06 | kr238.75 |
| 1966-07 | kr240 |
| 1966-08 | kr243.75 |
| 1966-09 | kr247.5 |
| 1966-10 | kr247.5 |
| 1966-11 | kr243.75 |
| 1966-12 | kr243.75 |
| 1967-01 | kr243.75 |
| 1967-02 | kr243.75 |
| 1967-03 | kr243.75 |
| 1967-04 | kr243.75 |
| 1967-05 | kr243.75 |
| 1967-06 | kr243.75 |
| 1967-07 | kr243.75 |
| 1967-08 | kr243.75 |
| 1967-09 | kr243.75 |
| 1967-10 | kr243.75 |
| 1967-11 | kr257.5 |
| 1967-12 | kr261.25 |
| 1968-01 | kr270.58 |
| 1968-02 | kr273.28 |
| 1968-03 | kr278.69 |
| 1968-04 | kr278.69 |
| 1968-05 | kr278.69 |
| 1968-06 | kr281.4 |
| 1968-07 | kr281.4 |
| 1968-08 | kr284.1 |
| 1968-09 | kr284.1 |
| 1968-10 | kr292.22 |
| 1968-11 | kr294.93 |
| 1968-12 | kr308.46 |
| 1969-01 | kr321.98 |
| 1969-02 | kr327.4 |
| 1969-03 | kr330.1 |
| 1969-04 | kr332.81 |
| 1969-05 | kr338.22 |
| 1969-06 | kr346.34 |
| 1969-07 | kr351.75 |
| 1969-08 | kr354.45 |
| 1969-09 | kr357.16 |
| 1969-10 | kr359.86 |
| 1969-11 | kr362.57 |
| 1969-12 | kr365.28 |
| 1970-01 | kr365.28 |
| 1970-02 | kr370.69 |
| 1970-03 | kr376.1 |
| 1970-04 | kr381.51 |
| 1970-05 | kr381.51 |
| 1970-06 | kr386.92 |
| 1970-07 | kr392.33 |
| 1970-08 | kr397.75 |
| 1970-09 | kr408.57 |
| 1970-10 | kr416.69 |
| 1970-11 | kr416.69 |
| 1970-12 | kr408.57 |
| 1971-01 | kr413.98 |
| 1971-02 | kr413.98 |
| 1971-03 | kr416.69 |
| 1971-04 | kr416.69 |
| 1971-05 | kr419.39 |
| 1971-06 | kr419.39 |
| 1971-07 | kr419.39 |
| 1971-08 | kr416.69 |
| 1971-09 | kr416.69 |
| 1971-10 | kr419.39 |
| 1971-11 | kr422.1 |
| 1971-12 | kr424.8 |
| 1972-01 | kr419.39 |
| 1972-02 | kr424.8 |
| 1972-03 | kr438.33 |
| 1972-04 | kr451.86 |
| 1972-05 | kr459.98 |
| 1972-06 | kr470.8 |
| 1972-07 | kr470.8 |
| 1972-08 | kr473.51 |
| 1972-09 | kr476.21 |
| 1972-10 | kr476.21 |
| 1972-11 | kr476.21 |
| 1972-12 | kr473.51 |
| 1973-01 | kr478.92 |
| 1973-02 | kr495.15 |
| 1973-03 | kr522.21 |
| 1973-04 | kr541.15 |
| 1973-05 | kr543.86 |
| 1973-06 | kr554.68 |
| 1973-07 | kr560.09 |
| 1973-08 | kr568.21 |
| 1973-09 | kr576.32 |
| 1973-10 | kr606.09 |
| 1973-11 | kr611.5 |
| 1973-12 | kr630.44 |
| 1974-01 | kr646.67 |
| 1974-02 | kr654.79 |
| 1974-03 | kr708.91 |
| 1974-04 | kr760.32 |
| 1974-05 | kr781.96 |
| 1974-06 | kr765.73 |
| 1974-07 | kr787.37 |
| 1974-08 | kr803.61 |
| 1974-09 | kr833.37 |
| 1974-10 | kr906.43 |
| 1974-11 | kr925.37 |
| 1974-12 | kr957.84 |
| 1975-01 | kr971.36 |
| 1975-02 | kr1,006.54 |
| 1975-03 | kr1,082.3 |
| 1975-04 | kr1,131 |
| 1975-05 | kr1,152.65 |
| 1975-06 | kr1,185.12 |
| 1975-07 | kr1,212.18 |
| 1975-08 | kr1,241.94 |
| 1975-09 | kr1,274.41 |
| 1975-10 | kr1,309.58 |
| 1975-11 | kr1,328.52 |
| 1975-12 | kr1,342.05 |
| 1976-01 | kr1,360.99 |
| 1976-02 | kr1,360.99 |
| 1976-03 | kr1,360.99 |
| 1976-04 | kr1,531.12 |
| 1976-05 | kr1,531.12 |
| 1976-06 | kr1,531.12 |
| 1976-07 | kr1,616.18 |
| 1976-08 | kr1,616.18 |
| 1976-09 | kr1,701.24 |
| 1976-10 | kr1,701.24 |
| 1976-11 | kr1,701.24 |
| 1976-12 | kr1,786.3 |
| 1977-01 | kr1,786.3 |
| 1977-02 | kr1,871.36 |
| 1977-03 | kr1,871.36 |
| 1977-04 | kr1,956.43 |
| 1977-05 | kr1,956.43 |
| 1977-06 | kr1,956.43 |
| 1977-07 | kr2,041.49 |
| 1977-08 | kr2,041.49 |
| 1977-09 | kr2,126.55 |
| 1977-10 | kr2,211.61 |
| 1977-11 | kr2,296.67 |
| 1977-12 | kr2,381.74 |
| 1978-01 | kr2,466.8 |
| 1978-02 | kr2,551.86 |
| 1978-03 | kr2,636.92 |
| 1978-04 | kr2,721.98 |
| 1978-05 | kr2,807.05 |
| 1978-06 | kr2,892.11 |
| 1978-07 | kr2,977.17 |
| 1978-08 | kr3,147.29 |
| 1978-09 | kr3,147.29 |
| 1978-10 | kr3,232.36 |
| 1978-11 | kr3,317.42 |
| 1978-12 | kr3,317.42 |
| 1979-01 | kr3,402.48 |
| 1979-02 | kr3,487.54 |
| 1979-03 | kr3,572.6 |
| 1979-04 | kr3,742.73 |
| 1979-05 | kr3,912.85 |
| 1979-06 | kr4,082.98 |
| 1979-07 | kr4,338.16 |
| 1979-08 | kr4,423.22 |
| 1979-09 | kr4,593.35 |
| 1979-10 | kr4,933.6 |
| 1979-11 | kr5,188.78 |
| 1979-12 | kr5,188.78 |
| 1980-01 | kr5,443.97 |
| 1980-02 | kr5,614.09 |
| 1980-03 | kr5,784.22 |
| 1980-04 | kr6,124.46 |
| 1980-05 | kr6,379.65 |
| 1980-06 | kr6,634.84 |
| 1980-07 | kr6,804.96 |
| 1980-08 | kr6,975.09 |
| 1980-09 | kr7,400.4 |
| 1980-10 | kr7,655.58 |
| 1980-11 | kr7,740.64 |
| 1980-12 | kr8,080.89 |
| 1981-01 | kr8,761.39 |
| 1981-02 | kr8,846.45 |
| 1981-03 | kr9,101.63 |
| 1981-04 | kr9,526.95 |
| 1981-05 | kr9,612.01 |
| 1981-06 | kr10,122.38 |
| 1981-07 | kr10,377.57 |
| 1981-08 | kr10,462.63 |
| 1981-09 | kr10,887.94 |
| 1981-10 | kr11,143.12 |
| 1981-11 | kr11,483.37 |
| 1981-12 | kr12,078.81 |
| 1982-01 | kr12,333.99 |
| 1982-02 | kr12,589.18 |
| 1982-03 | kr13,269.67 |
| 1982-04 | kr13,865.11 |
| 1982-05 | kr13,950.17 |
| 1982-06 | kr14,715.73 |
| 1982-07 | kr15,141.04 |
| 1982-08 | kr15,651.41 |
| 1982-09 | kr16,927.34 |
| 1982-10 | kr17,692.9 |
| 1982-11 | kr18,373.4 |
| 1982-12 | kr19,394.14 |
| 1983-01 | kr20,159.7 |
| 1983-02 | kr21,095.38 |
| 1983-03 | kr23,306.99 |
| 1983-04 | kr24,923.17 |
| 1983-05 | kr26,114.04 |
| 1983-06 | kr28,580.84 |
| 1983-07 | kr29,686.65 |
| 1983-08 | kr31,643.07 |
| 1983-09 | kr31,898.26 |
| 1983-10 | kr32,919 |
| 1983-11 | kr33,769.62 |
| 1983-12 | kr34,194.93 |
| 1984-01 | kr34,450.12 |
| 1984-02 | kr34,705.3 |
| 1984-03 | kr35,045.55 |
| 1984-04 | kr35,555.93 |
| 1984-05 | kr35,896.17 |
| 1984-06 | kr36,746.78 |
| 1984-07 | kr37,087.04 |
| 1984-08 | kr37,597.42 |
| 1984-09 | kr37,852.61 |
| 1984-10 | kr38,277.91 |
| 1984-11 | kr38,788.28 |
| 1984-12 | kr40,659.64 |
| 1985-01 | kr42,445.95 |
| 1985-02 | kr43,892.01 |
| 1985-03 | kr45,082.87 |
| 1985-04 | kr45,848.44 |
| 1985-05 | kr46,784.11 |
| 1985-06 | kr47,634.72 |
| 1985-07 | kr48,825.62 |
| 1985-08 | kr50,271.67 |
| 1985-09 | kr51,547.58 |
| 1985-10 | kr52,738.44 |
| 1985-11 | kr53,929.31 |
| 1985-12 | kr55,290.32 |
| 1986-01 | kr56,906.49 |
| 1986-02 | kr58,182.43 |
| 1986-03 | kr57,331.79 |
| 1986-04 | kr57,672.05 |
| 1986-05 | kr58,692.8 |
| 1986-06 | kr59,033.03 |
| 1986-07 | kr59,288.22 |
| 1986-08 | kr59,968.71 |
| 1986-09 | kr60,649.23 |
| 1986-10 | kr60,904.42 |
| 1986-11 | kr62,180.32 |
| 1986-12 | kr62,775.77 |
| 1987-01 | kr64,221.83 |
| 1987-02 | kr65,157.5 |
| 1987-03 | kr66,178.26 |
| 1987-04 | kr67,028.86 |
| 1987-05 | kr67,879.5 |
| 1987-06 | kr69,240.48 |
| 1987-07 | kr70,431.34 |
| 1987-08 | kr72,217.66 |
| 1987-09 | kr72,983.22 |
| 1987-10 | kr74,174.09 |
| 1987-11 | kr76,555.82 |
| 1987-12 | kr78,086.95 |
| 1988-01 | kr80,979.05 |
| 1988-02 | kr81,659.54 |
| 1988-03 | kr82,425.1 |
| 1988-04 | kr83,615.97 |
| 1988-05 | kr85,062.02 |
| 1988-06 | kr87,954.13 |
| 1988-07 | kr91,016.35 |
| 1988-08 | kr92,972.78 |
| 1988-09 | kr93,568.23 |
| 1988-10 | kr93,908.46 |
| 1988-11 | kr93,993.53 |
| 1988-12 | kr94,163.64 |
| 1989-01 | kr95,779.85 |
| 1989-02 | kr97,140.82 |
| 1989-03 | kr99,862.82 |
| 1989-04 | kr101,989.36 |
| 1989-05 | kr104,030.86 |
| 1989-06 | kr107,093.08 |
| 1989-07 | kr107,858.65 |
| 1989-08 | kr109,304.7 |
| 1989-09 | kr111,516.32 |
| 1989-10 | kr113,727.94 |
| 1989-11 | kr115,429.18 |
| 1989-12 | kr117,895.95 |
| 1990-01 | kr118,491.4 |
| 1990-02 | kr120,362.75 |
| 1990-03 | kr121,383.5 |
| 1990-04 | kr121,723.77 |
| 1990-05 | kr122,829.56 |
| 1990-06 | kr123,680.16 |
| 1990-07 | kr124,530.8 |
| 1990-08 | kr124,871.02 |
| 1990-09 | kr124,871.02 |
| 1990-10 | kr125,211.29 |
| 1990-11 | kr126,061.92 |
| 1990-12 | kr126,402.15 |
| 1991-01 | kr127,167.72 |
| 1991-02 | kr127,593.05 |
| 1991-03 | kr127,848.2 |
| 1991-04 | kr128,443.66 |
| 1991-05 | kr129,974.78 |
| 1991-06 | kr131,761.06 |
| 1991-07 | kr132,696.74 |
| 1991-08 | kr133,717.49 |
| 1991-09 | kr134,483.06 |
| 1991-10 | kr135,503.81 |
| 1991-11 | kr136,099.22 |
| 1991-12 | kr135,929.11 |
| 1992-01 | kr136,269.34 |
| 1992-02 | kr136,439.49 |
| 1992-03 | kr136,609.6 |
| 1992-04 | kr136,609.6 |
| 1992-05 | kr136,524.52 |
| 1992-06 | kr137,034.9 |
| 1992-07 | kr137,290.09 |
| 1992-08 | kr137,290.09 |
| 1992-09 | kr137,205.05 |
| 1992-10 | kr137,290.09 |
| 1992-11 | kr137,159.2 |
| 1992-12 | kr137,917.81 |
| 1993-01 | kr139,586.78 |
| 1993-02 | kr140,497.13 |
| 1993-03 | kr140,648.83 |
| 1993-04 | kr141,104.01 |
| 1993-05 | kr141,407.48 |
| 1993-06 | kr141,255.74 |
| 1993-07 | kr142,621.27 |
| 1993-08 | kr143,835.06 |
| 1993-09 | kr144,290.24 |
| 1993-10 | kr145,200.59 |
| 1993-11 | kr145,200.59 |
| 1993-12 | kr144,441.97 |
| 1994-01 | kr143,986.8 |
| 1994-02 | kr144,138.5 |
| 1994-03 | kr144,290.24 |
| 1994-04 | kr144,441.97 |
| 1994-05 | kr144,441.97 |
| 1994-06 | kr144,593.68 |
| 1994-07 | kr144,897.15 |
| 1994-08 | kr144,897.15 |
| 1994-09 | kr145,352.33 |
| 1994-10 | kr145,200.59 |
| 1994-11 | kr145,200.59 |
| 1994-12 | kr145,200.59 |
| 1995-01 | kr146,262.68 |
| 1995-02 | kr146,566.11 |
| 1995-03 | kr146,262.68 |
| 1995-04 | kr146,110.94 |
| 1995-05 | kr146,262.68 |
| 1995-06 | kr146,566.11 |
| 1995-07 | kr146,869.55 |
| 1995-08 | kr147,476.47 |
| 1995-09 | kr147,931.64 |
| 1995-10 | kr148,690.26 |
| 1995-11 | kr148,235.08 |
| 1995-12 | kr148,083.34 |
| 1996-01 | kr148,690.26 |
| 1996-02 | kr148,993.69 |
| 1996-03 | kr149,297.17 |
| 1996-04 | kr149,448.87 |
| 1996-05 | kr150,359.22 |
| 1996-06 | kr150,207.52 |
| 1996-07 | kr150,359.22 |
| 1996-08 | kr151,421.31 |
| 1996-09 | kr151,724.75 |
| 1996-10 | kr151,724.75 |
| 1996-11 | kr151,876.49 |
| 1996-12 | kr151,117.83 |
| 1997-01 | kr151,724.75 |
| 1997-02 | kr151,724.75 |
| 1997-03 | kr151,724.75 |
| 1997-04 | kr152,786.84 |
| 1997-05 | kr152,635.1 |
| 1997-06 | kr152,938.54 |
| 1997-07 | kr153,242.01 |
| 1997-08 | kr153,697.19 |
| 1997-09 | kr154,152.36 |
| 1997-10 | kr154,607.54 |
| 1997-11 | kr154,455.8 |
| 1997-12 | kr154,304.06 |
| 1998-01 | kr155,062.68 |
| 1998-02 | kr154,759.24 |
| 1998-03 | kr155,366.15 |
| 1998-04 | kr155,517.89 |
| 1998-05 | kr156,124.77 |
| 1998-06 | kr156,428.24 |
| 1998-07 | kr155,973.03 |
| 1998-08 | kr155,214.42 |
| 1998-09 | kr155,366.15 |
| 1998-10 | kr156,124.77 |
| 1998-11 | kr156,428.24 |
| 1998-12 | kr156,124.77 |
| 1999-01 | kr157,035.12 |
| 1999-02 | kr156,883.38 |
| 1999-03 | kr157,642.03 |
| 1999-04 | kr158,552.38 |
| 1999-05 | kr159,159.26 |
| 1999-06 | kr160,524.79 |
| 1999-07 | kr160,979.96 |
| 1999-08 | kr161,586.87 |
| 1999-09 | kr163,104.1 |
| 1999-10 | kr164,317.93 |
| 1999-11 | kr164,317.93 |
| 1999-12 | kr164,773.07 |
| 2000-01 | kr166,138.59 |
| 2000-02 | kr165,683.42 |
| 2000-03 | kr166,897.24 |
| 2000-04 | kr167,959.3 |
| 2000-05 | kr168,566.21 |
| 2000-06 | kr169,173.12 |
| 2000-07 | kr170,083.47 |
| 2000-08 | kr169,173.12 |
| 2000-09 | kr169,476.56 |
| 2000-10 | kr171,297.26 |
| 2000-11 | kr171,752.44 |
| 2000-12 | kr171,752.44 |
| 2001-01 | kr172,055.88 |
| 2001-02 | kr172,359.32 |
| 2001-03 | kr173,269.67 |
| 2001-04 | kr175,393.81 |
| 2001-05 | kr177,973.16 |
| 2001-06 | kr180,704.18 |
| 2001-07 | kr182,115.44 |
| 2001-08 | kr182,692.85 |
| 2001-09 | kr183,897.5 |
| 2001-10 | kr185,083.31 |
| 2001-11 | kr185,720.06 |
| 2001-12 | kr186,580.09 |
| 2002-01 | kr188,340.79 |
| 2002-02 | kr187,835.25 |
| 2002-03 | kr188,593.86 |
| 2002-04 | kr188,593.86 |
| 2002-05 | kr188,593.86 |
| 2002-06 | kr189,397.89 |
| 2002-07 | kr189,562.04 |
| 2002-08 | kr188,593.86 |
| 2002-09 | kr189,504.22 |
| 2002-10 | kr190,566.3 |
| 2002-11 | kr190,111.13 |
| 2002-12 | kr190,295.83 |
| 2003-01 | kr190,978.87 |
| 2003-02 | kr190,718.01 |
| 2003-03 | kr192,699.94 |
| 2003-04 | kr192,993.88 |
| 2003-05 | kr192,690.44 |
| 2003-06 | kr192,690.44 |
| 2003-07 | kr192,538.71 |
| 2003-08 | kr192,387.01 |
| 2003-09 | kr193,752.5 |
| 2003-10 | kr194,662.85 |
| 2003-11 | kr194,966.32 |
| 2003-12 | kr195,573.2 |
| 2004-01 | kr195,573.2 |
| 2004-02 | kr194,966.32 |
| 2004-03 | kr196,180.11 |
| 2004-04 | kr197,242.2 |
| 2004-05 | kr198,911.17 |
| 2004-06 | kr200,428.39 |
| 2004-07 | kr199,518.04 |
| 2004-08 | kr199,518.04 |
| 2004-09 | kr200,276.69 |
| 2004-10 | kr201,793.92 |
| 2004-11 | kr202,249.1 |
| 2004-12 | kr203,159.45 |
| 2005-01 | kr203,311.19 |
| 2005-02 | kr203,766.36 |
| 2005-03 | kr205,283.59 |
| 2005-04 | kr205,738.76 |
| 2005-05 | kr204,676.68 |
| 2005-06 | kr206,042.24 |
| 2005-07 | kr206,345.68 |
| 2005-08 | kr206,649.12 |
| 2005-09 | kr209,835.34 |
| 2005-10 | kr211,200.87 |
| 2005-11 | kr210,745.7 |
| 2005-12 | kr211,504.31 |
| 2006-01 | kr212,262.92 |
| 2006-02 | kr212,111.22 |
| 2006-03 | kr214,387.06 |
| 2006-04 | kr216,966.42 |
| 2006-05 | kr220,152.61 |
| 2006-06 | kr222,731.96 |
| 2006-07 | kr223,684.12 |
| 2006-08 | kr224,400.93 |
| 2006-09 | kr225,766.46 |
| 2006-10 | kr226,221.59 |
| 2006-11 | kr226,221.59 |
| 2006-12 | kr226,373.33 |
| 2007-01 | kr226,828.51 |
| 2007-02 | kr227,738.86 |
| 2007-03 | kr226,980.25 |
| 2007-04 | kr228,497.47 |
| 2007-05 | kr230,318.18 |
| 2007-06 | kr231,531.96 |
| 2007-07 | kr232,138.88 |
| 2007-08 | kr232,138.88 |
| 2007-09 | kr235,173.37 |
| 2007-10 | kr236,387.16 |
| 2007-11 | kr237,904.42 |
| 2007-12 | kr239,573.39 |
| 2008-01 | kr240,028.56 |
| 2008-02 | kr243,324.21 |
| 2008-03 | kr246,899.68 |
| 2008-04 | kr255,264.96 |
| 2008-05 | kr258,742.18 |
| 2008-06 | kr261,075.48 |
| 2008-07 | kr263,564.15 |
| 2008-08 | kr265,885.52 |
| 2008-09 | kr268,254.66 |
| 2008-10 | kr273,976.28 |
| 2008-11 | kr278,722.64 |
| 2008-12 | kr283,039 |
| 2009-01 | kr284,591.53 |
| 2009-02 | kr286,051.3 |
| 2009-03 | kr284,364.43 |
| 2009-04 | kr285,604.71 |
| 2009-05 | kr288,915.93 |
| 2009-06 | kr292,879.88 |
| 2009-07 | kr293,371.12 |
| 2009-08 | kr294,891.84 |
| 2009-09 | kr297,247 |
| 2009-10 | kr300,576.82 |
| 2009-11 | kr302,808.09 |
| 2009-12 | kr304,225.72 |
| 2010-01 | kr303,356.2 |
| 2010-02 | kr306,789.86 |
| 2010-03 | kr308,523.16 |
| 2010-04 | kr309,289.31 |
| 2010-05 | kr310,522.93 |
| 2010-06 | kr309,565.57 |
| 2010-07 | kr307,526.72 |
| 2010-08 | kr308,291.66 |
| 2010-09 | kr308,254.26 |
| 2010-10 | kr310,592.72 |
| 2010-11 | kr310,758.8 |
| 2010-12 | kr311,780.89 |
| 2011-01 | kr308,952.36 |
| 2011-02 | kr312,569.24 |
| 2011-03 | kr315,584.81 |
| 2011-04 | kr318,068.9 |
| 2011-05 | kr320,976.47 |
| 2011-06 | kr322,651.22 |
| 2011-07 | kr322,946.43 |
| 2011-08 | kr323,850.09 |
| 2011-09 | kr325,849.02 |
| 2011-10 | kr326,926.35 |
| 2011-11 | kr326,983.63 |
| 2011-12 | kr328,141.6 |
| 2012-01 | kr329,095.14 |
| 2012-02 | kr332,374.85 |
| 2012-03 | kr335,904.37 |
| 2012-04 | kr338,482.48 |
| 2012-05 | kr338,441.54 |
| 2012-06 | kr340,146.93 |
| 2012-07 | kr337,667.25 |
| 2012-08 | kr337,148.65 |
| 2012-09 | kr339,753.25 |
| 2012-10 | kr340,656.4 |
| 2012-11 | kr341,734.86 |
| 2012-12 | kr341,933.07 |
| 2013-01 | kr342,871.69 |
| 2013-02 | kr348,472.04 |
| 2013-03 | kr349,175.41 |
| 2013-04 | kr349,798.85 |
| 2013-05 | kr349,631.83 |
| 2013-06 | kr351,561.62 |
| 2013-07 | kr350,605.17 |
| 2013-08 | kr351,814.19 |
| 2013-09 | kr352,991.52 |
| 2013-10 | kr353,009.86 |
| 2013-11 | kr354,273.24 |
| 2013-12 | kr356,089.76 |
| 2014-01 | kr353,538.79 |
| 2014-02 | kr355,943.26 |
| 2014-03 | kr356,809.33 |
| 2014-04 | kr357,909.34 |
| 2014-05 | kr358,177.51 |
| 2014-06 | kr359,428.93 |
| 2014-07 | kr358,874.41 |
| 2014-08 | kr359,703.29 |
| 2014-09 | kr359,272.5 |
| 2014-10 | kr359,752.85 |
| 2014-11 | kr357,935.57 |
| 2014-12 | kr359,033.94 |
| 2015-01 | kr356,429.3 |
| 2015-02 | kr358,816.34 |
| 2015-03 | kr362,467.35 |
| 2015-04 | kr363,045.26 |
| 2015-05 | kr364,059.36 |
| 2015-06 | kr364,929.75 |
| 2015-07 | kr365,585.46 |
| 2015-08 | kr367,510.74 |
| 2015-09 | kr366,086.16 |
| 2015-10 | kr366,285.93 |
| 2015-11 | kr365,058.57 |
| 2015-12 | kr366,268.1 |
| 2016-01 | kr364,087.01 |
| 2016-02 | kr366,597.41 |
| 2016-03 | kr367,936.85 |
| 2016-04 | kr368,684.98 |
| 2016-05 | kr370,193.26 |
| 2016-06 | kr370,875.16 |
| 2016-07 | kr369,724.94 |
| 2016-08 | kr371,034.18 |
| 2016-09 | kr372,819 |
| 2016-10 | kr372,807.72 |
| 2016-11 | kr372,676.73 |
| 2016-12 | kr373,202.17 |
| 2017-01 | kr371,069.84 |
| 2017-02 | kr373,739.98 |
| 2017-03 | kr373,949.57 |
| 2017-04 | kr375,863.57 |
| 2017-05 | kr376,594.97 |
| 2017-06 | kr376,600.79 |
| 2017-07 | kr376,480.35 |
| 2017-08 | kr377,473.01 |
| 2017-09 | kr377,965.7 |
| 2017-10 | kr379,753.8 |
| 2017-11 | kr379,136.3 |
| 2017-12 | kr380,184.27 |
| 2018-01 | kr379,869.51 |
| 2018-02 | kr382,101.18 |
| 2018-03 | kr384,255.7 |
| 2018-04 | kr384,389.25 |
| 2018-05 | kr384,109.43 |
| 2018-06 | kr386,461.17 |
| 2018-07 | kr386,662.76 |
| 2018-08 | kr387,363.95 |
| 2018-09 | kr388,356.25 |
| 2018-10 | kr390,555.9 |
| 2018-11 | kr391,524.18 |
| 2018-12 | kr394,399.18 |
| 2019-01 | kr392,732.62 |
| 2019-02 | kr393,490.21 |
| 2019-03 | kr395,544.31 |
| 2019-04 | kr396,979.44 |
| 2019-05 | kr397,895.69 |
| 2019-06 | kr399,385.05 |
| 2019-07 | kr398,505.91 |
| 2019-08 | kr399,624.11 |
| 2019-09 | kr399,980.71 |
| 2019-10 | kr401,430.77 |
| 2019-11 | kr401,922.73 |
| 2019-12 | kr402,407.42 |
| 2020-01 | kr399,402.15 |
| 2020-02 | kr403,086.05 |
| 2020-03 | kr403,972.83 |
| 2020-04 | kr405,973.43 |
| 2020-05 | kr408,147.24 |
| 2020-06 | kr409,972.09 |
| 2020-07 | kr410,554.3 |
| 2020-08 | kr412,406.44 |
| 2020-09 | kr413,993.31 |
| 2020-10 | kr415,763.22 |
| 2020-11 | kr415,960.44 |
| 2020-12 | kr416,794.81 |
| 2021-01 | kr416,573.21 |
| 2021-02 | kr419,421.29 |
| 2021-03 | kr421,491.39 |
| 2021-04 | kr424,434.44 |
| 2021-05 | kr426,285.49 |
| 2021-06 | kr427,380.4 |
| 2021-07 | kr428,055.4 |
| 2021-08 | kr430,021.43 |
| 2021-09 | kr432,007.12 |
| 2021-10 | kr434,627.77 |
| 2021-11 | kr436,108.03 |
| 2021-12 | kr438,100.99 |
| 2022-01 | kr440,251.88 |
| 2022-02 | kr445,373.83 |
| 2022-03 | kr449,591.18 |
| 2022-04 | kr455,123.59 |
| 2022-05 | kr458,640.11 |
| 2022-06 | kr465,069.48 |
| 2022-07 | kr470,559.68 |
| 2022-08 | kr471,884.93 |
| 2022-09 | kr472,349.24 |
| 2022-10 | kr475,505.88 |
| 2022-11 | kr476,810.02 |
| 2022-12 | kr479,960.12 |
| 2023-01 | kr484,025.01 |
| 2023-02 | kr490,782.96 |
| 2023-03 | kr493,689.26 |
| 2023-04 | kr500,132.09 |
| 2023-05 | kr502,059.92 |
| 2023-06 | kr506,335.85 |
| 2023-07 | kr506,542.17 |
| 2023-08 | kr508,194.91 |
| 2023-09 | kr509,965.18 |
| 2023-10 | kr513,053.41 |
| 2023-11 | kr515,012.9 |
| 2023-12 | kr517,163.42 |
| 2024-01 | kr516,253.36 |
| 2024-02 | kr523,159.05 |
| 2024-03 | kr527,294.53 |
| 2024-04 | kr530,258.32 |
| 2024-05 | kr533,250.85 |
| 2024-06 | kr535,871.14 |
| 2024-07 | kr538,304.4 |
| 2024-08 | kr538,813.46 |
| 2024-09 | kr537,528.25 |
| 2024-10 | kr539,074 |
| 2024-11 | kr539,600.53 |
| 2024-12 | kr541,708.85 |
| 2025-01 | kr540,259.52 |
| 2025-02 | kr545,207.54 |
| 2025-03 | kr547,247.44 |
| 2025-04 | kr552,318.82 |
| 2025-05 | kr553,394.8 |
| 2025-06 | kr558,069.55 |
| 2025-07 | kr559,902.77 |
| 2025-08 | kr559,056.03 |
| 2025-09 | kr559,642.96 |
| 2025-10 | kr562,291.63 |
| 2025-11 | kr559,550.54 |
| 2025-12 | kr566,039.58 |
| 2026-01 | kr568,303.63 |
| 2026-02 | kr573,397.93 |
| 2026-03 | kr576,794.38 |
| 2026-04 | kr581,322.48 |
| 2026-05 | kr581,888.68 |
| 2026-06 | kr586,982.97 |
All available years
Today's value of Icelandic kronur by year:
1955 | 1956 | 1957 | 1958 | 1959 | 1960 | 1961 | 1962 | 1963 | 1964 | 1965 | 1966 | 1967 | 1968 | 1969 | 1970 | 1971 | 1972 | 1973 | 1974 | 1975 | 1976 | 1977 | 1978 | 1979 | 1980 | 1981 | 1982 | 1983 | 1984 | 1985 | 1986 | 1987 | 1988 | 1989 | 1990 | 1991 | 1992 | 1993 | 1994 | 1995 | 1996 | 1997 | 1998 | 1999 | 2000 | 2001 | 2002 | 2003 | 2004 | 2005 | 2006 | 2007 | 2008 | 2009 | 2010 | 2011 | 2012 | 2013 | 2014 | 2015 | 2016 | 2017 | 2018 | 2019 | 2020 | 2021 | 2022 | 2023 | 2024 | 2025 |
Other currencies: